A Picture is Worth 1,000 Words…
I transform complex information into purposeful visual stories through strategic infographic and data visualization design for business, editorial and financial reports. From refined charts and diagrams to full-page data narratives, each visual enhances clarity, comprehension, and professional communication across print and digital publications.
Data Visualizations
A sampler of different types and styles of data visualizations.
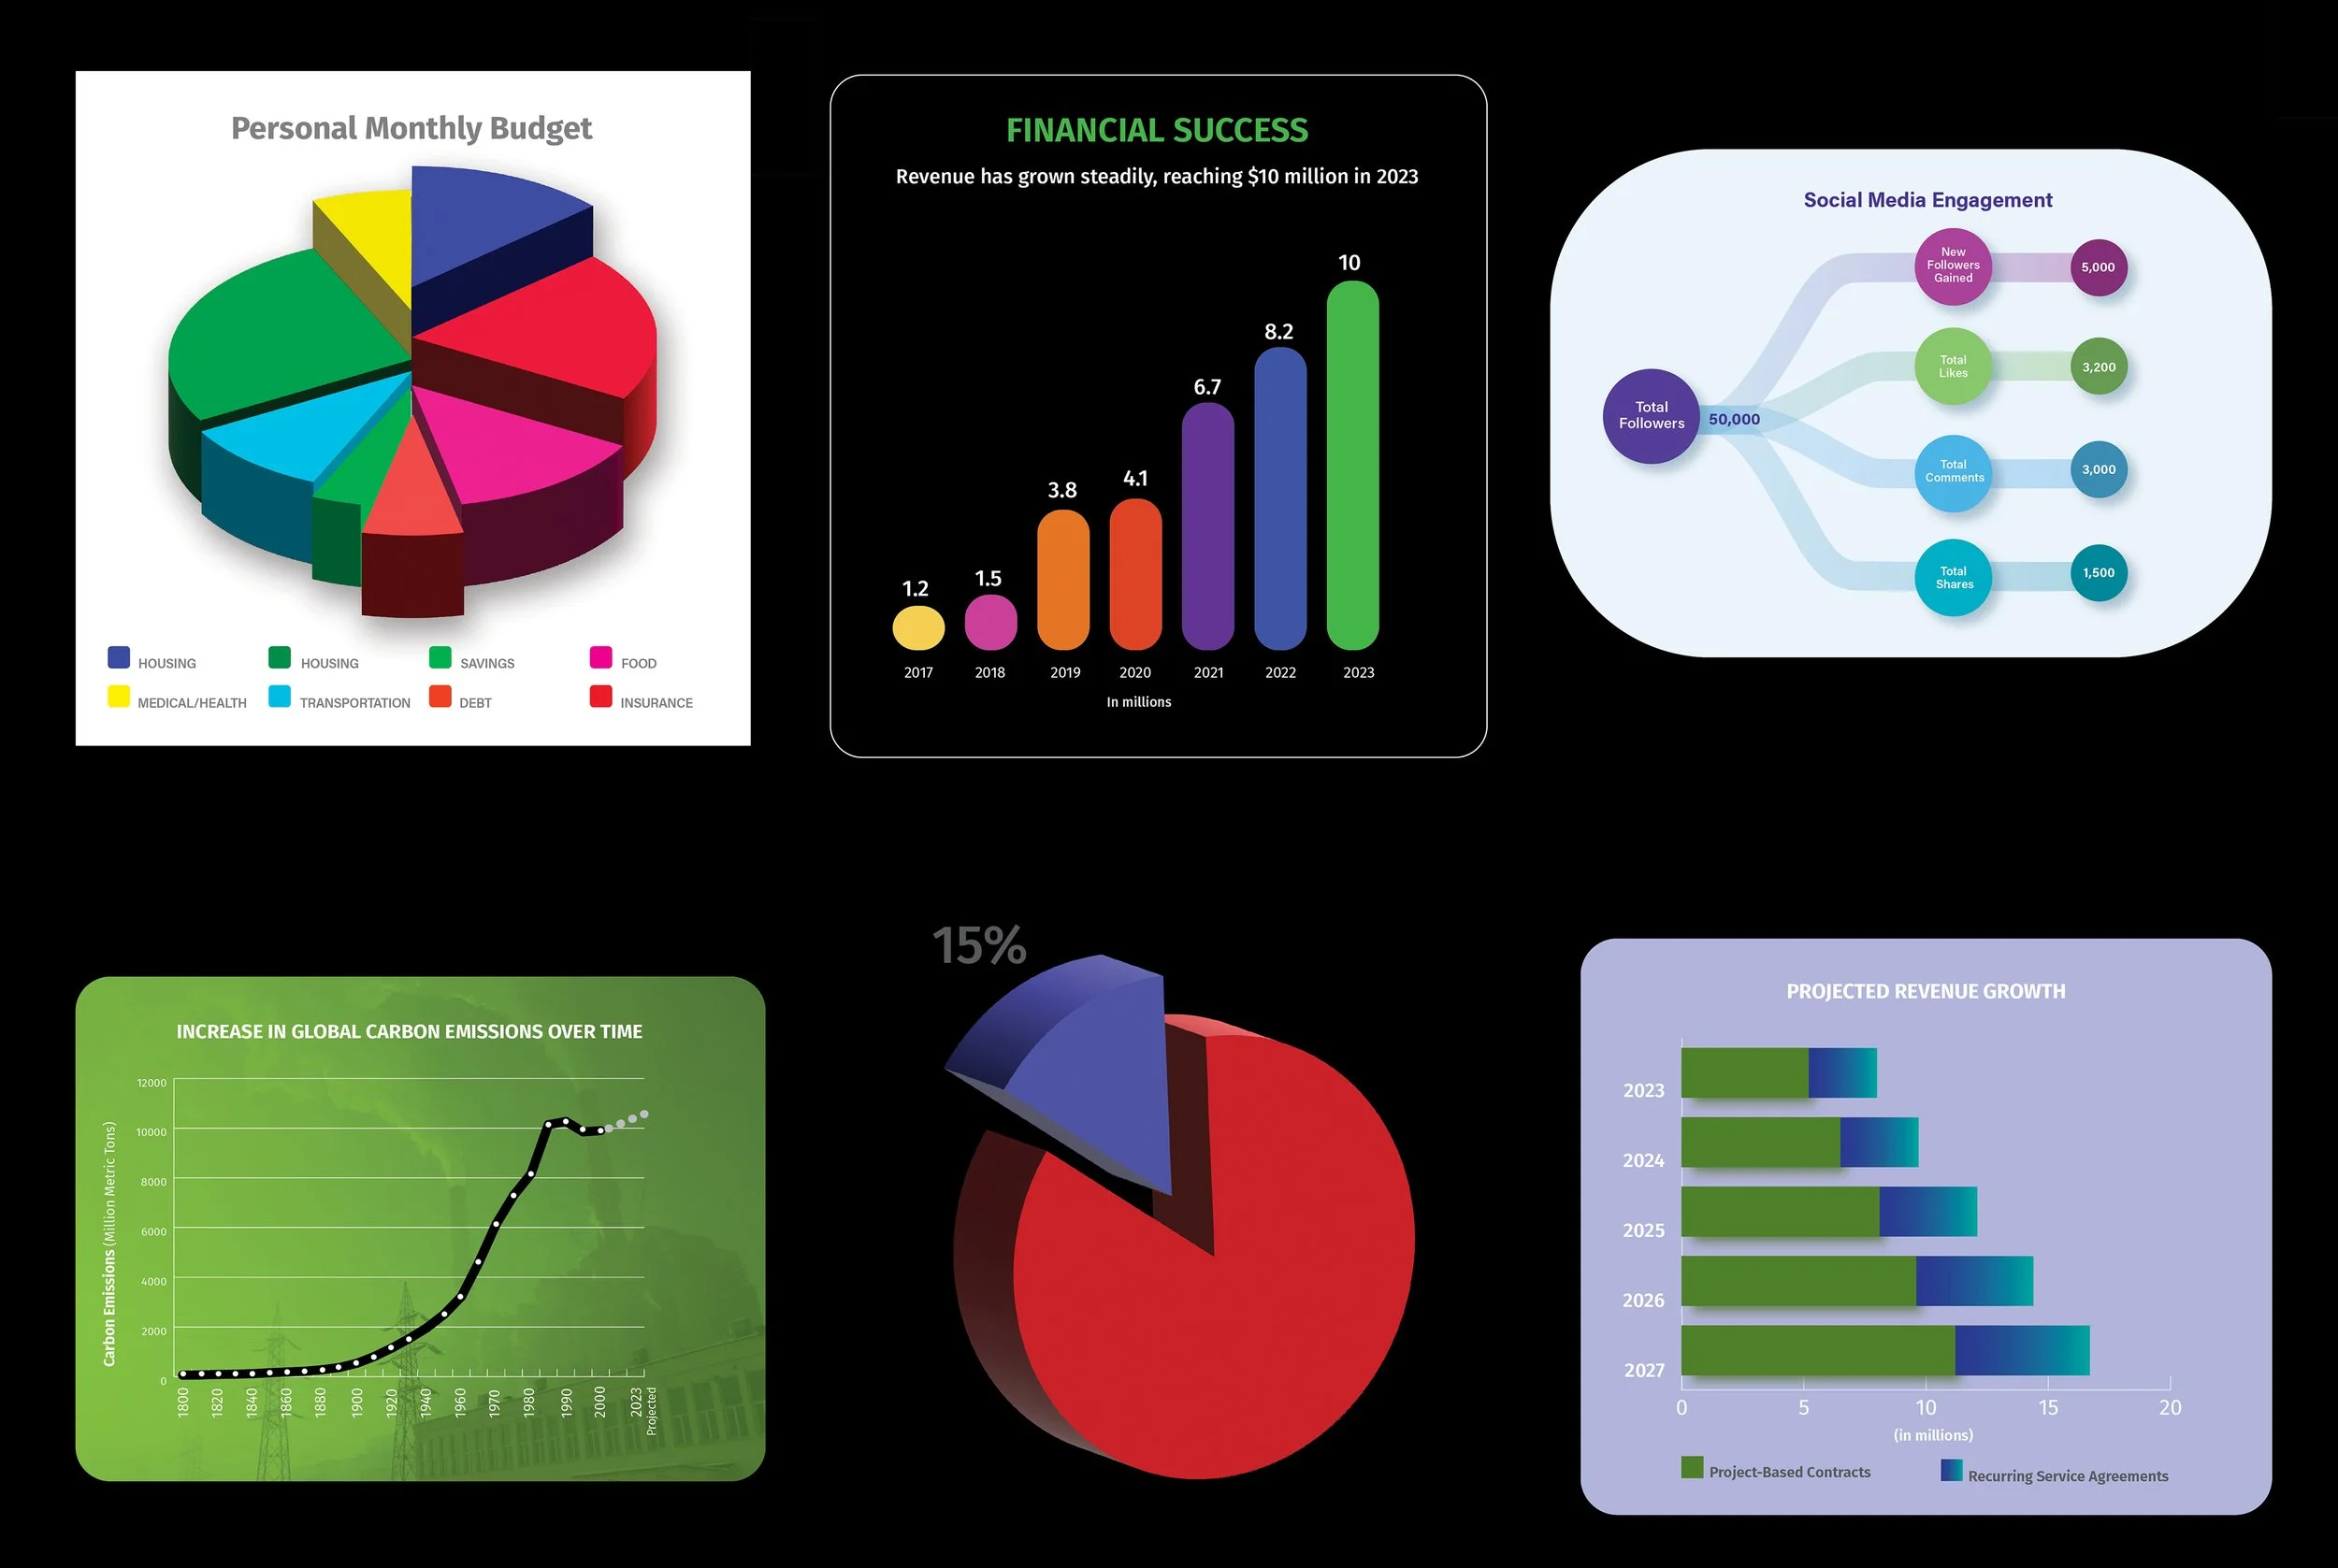
Custom data visualizations design customized to integrate cohesively and compliment the character of the report.
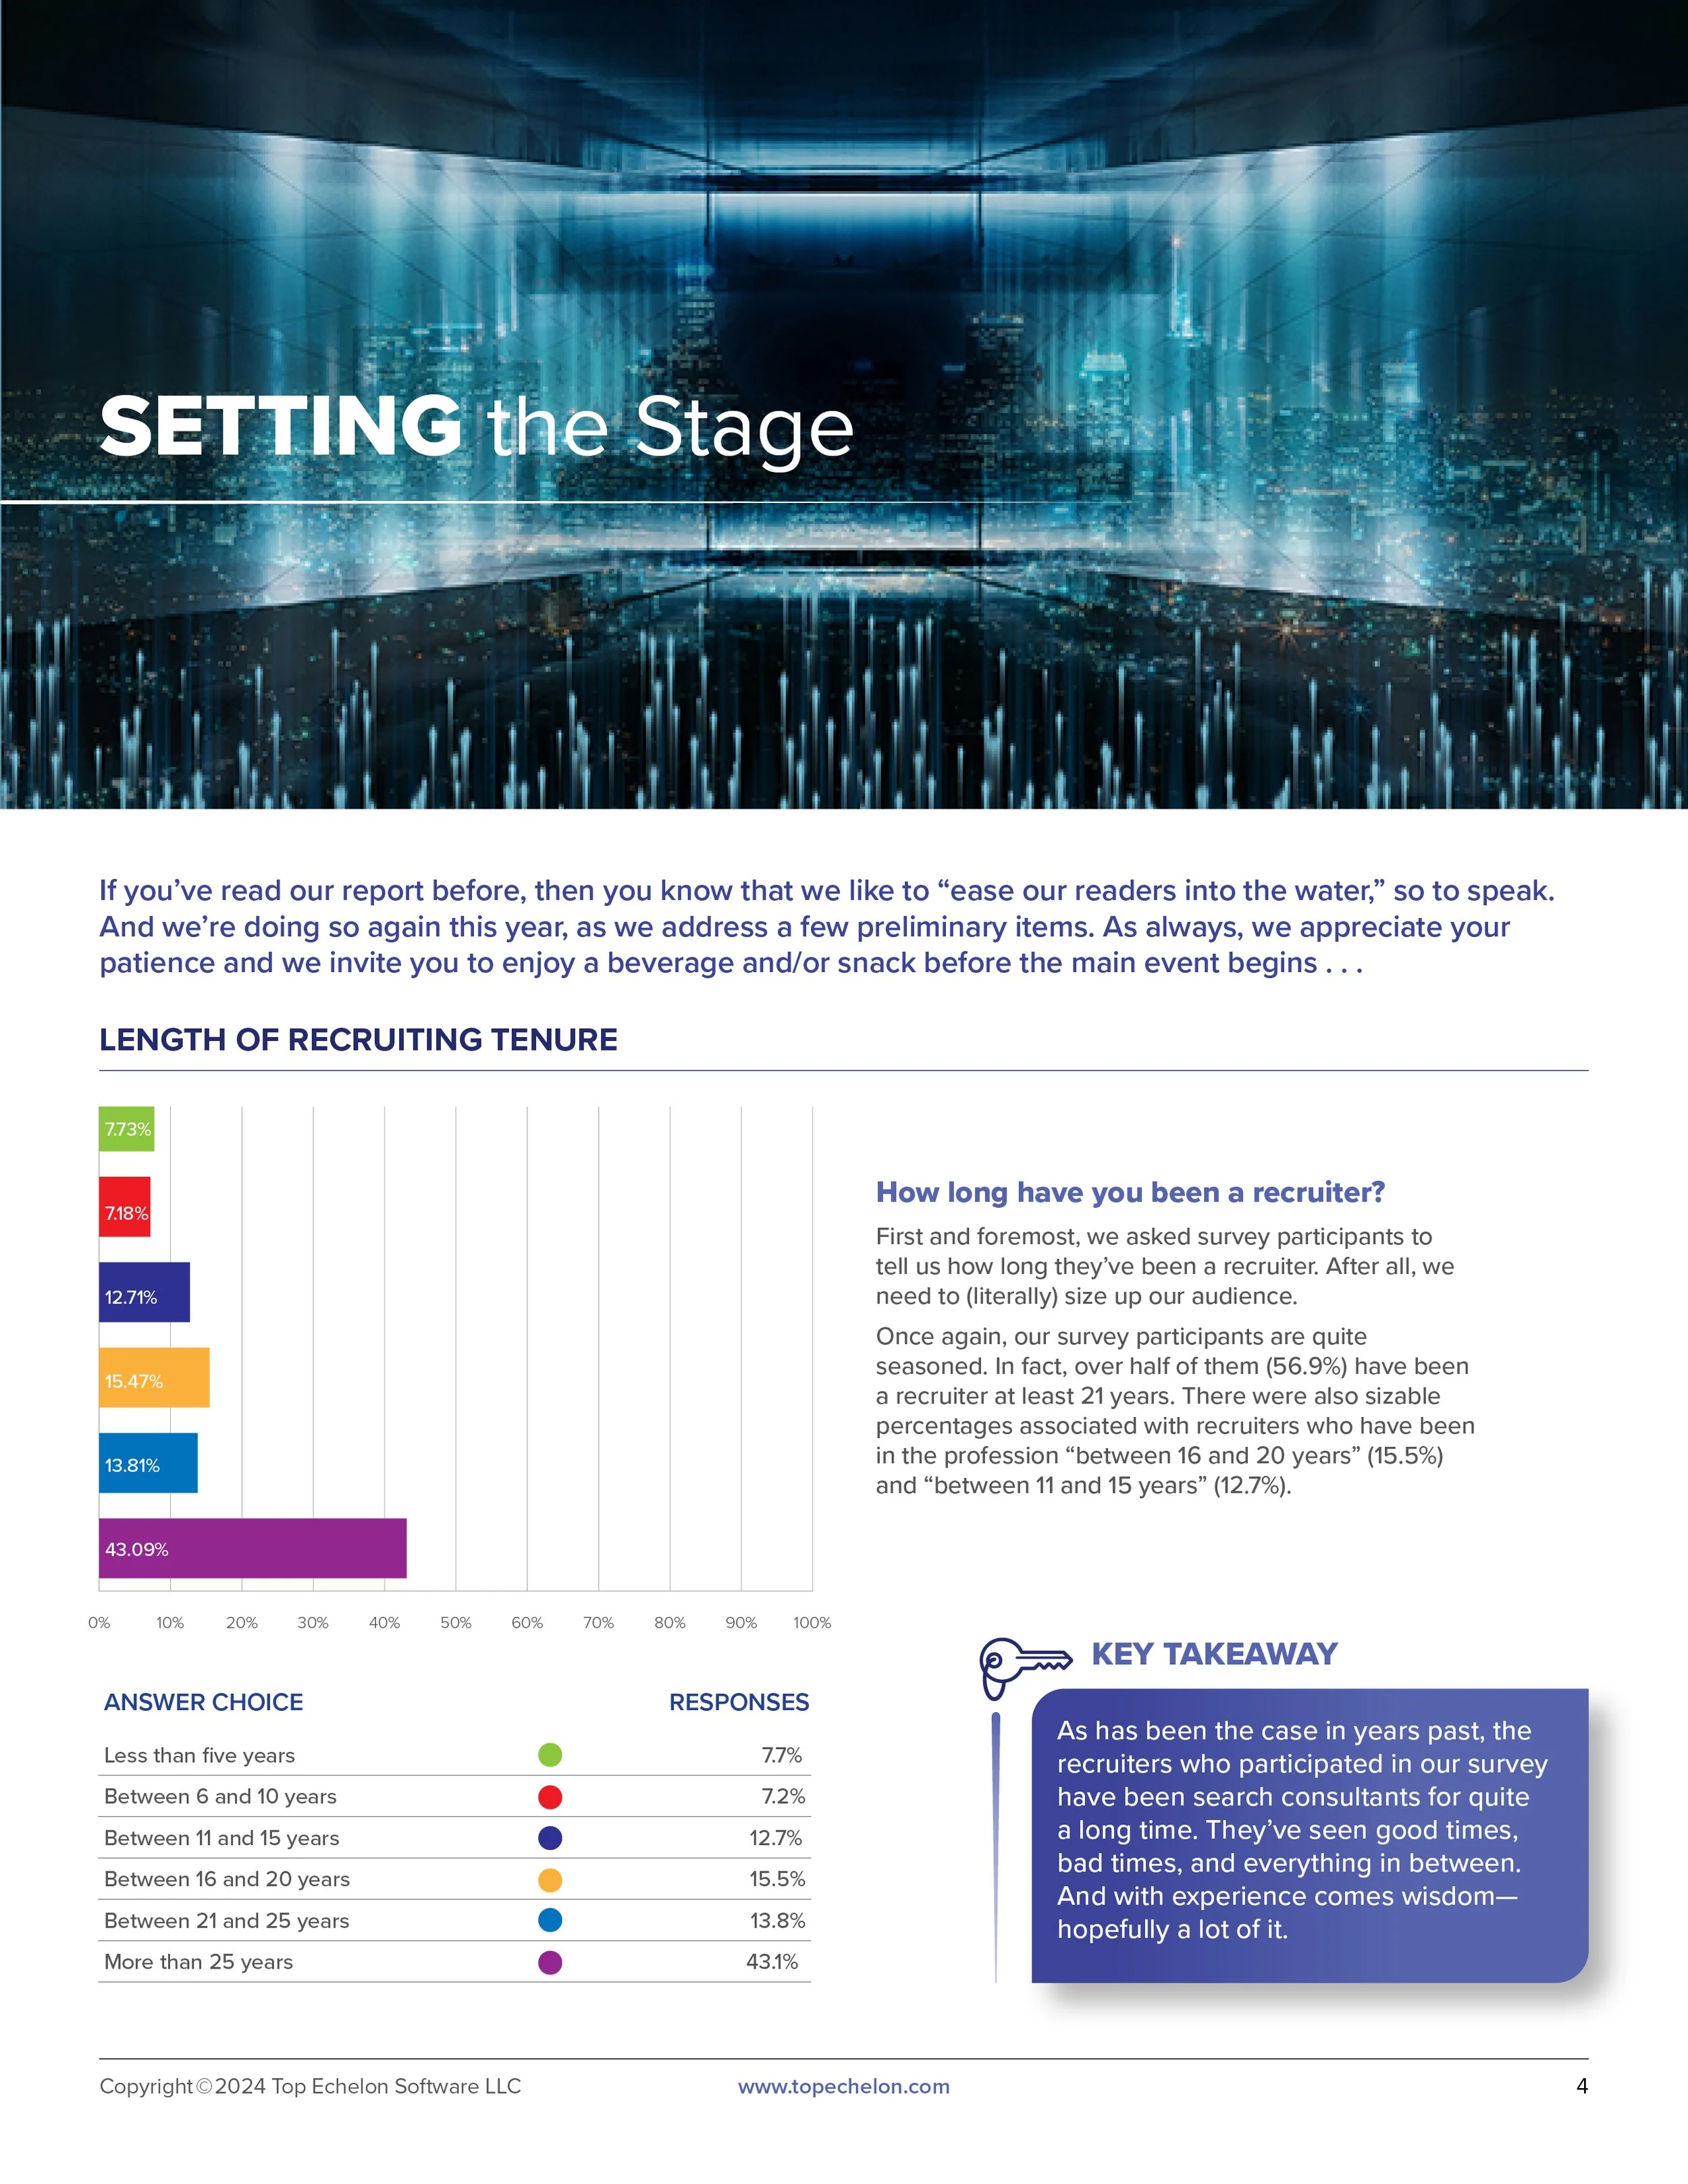
Client: Top Echelon
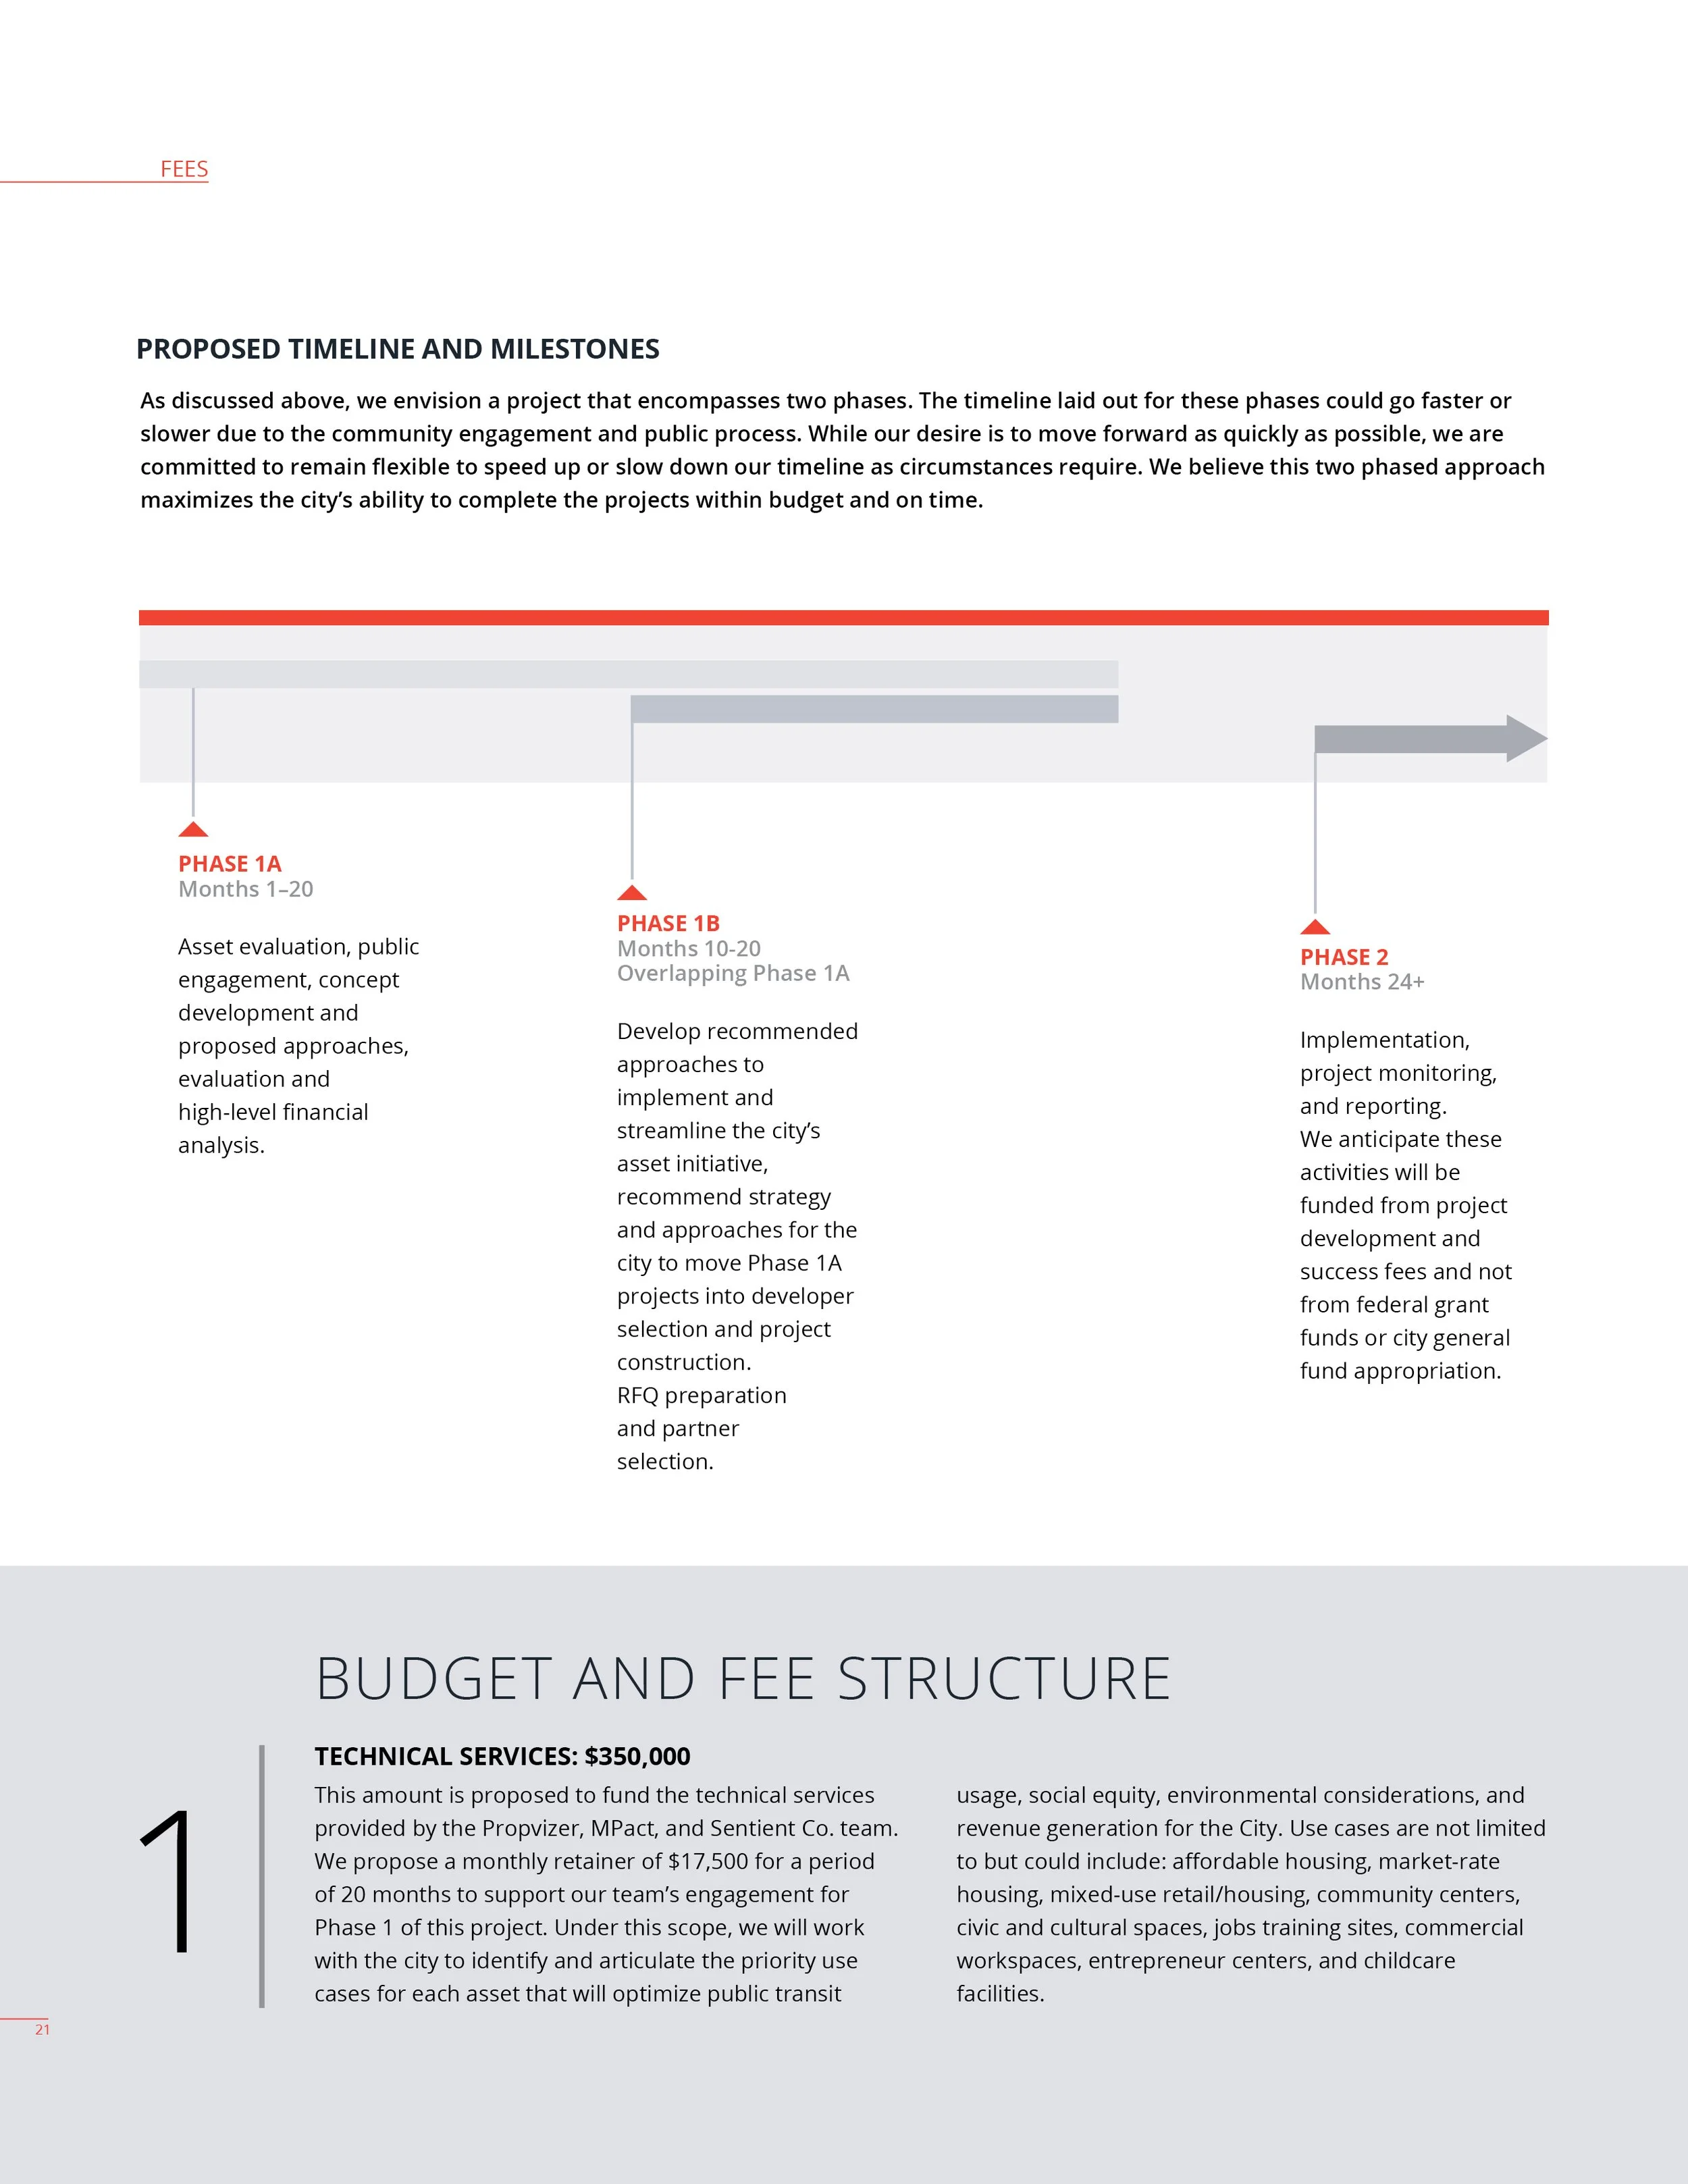
Client: MPACT Collective
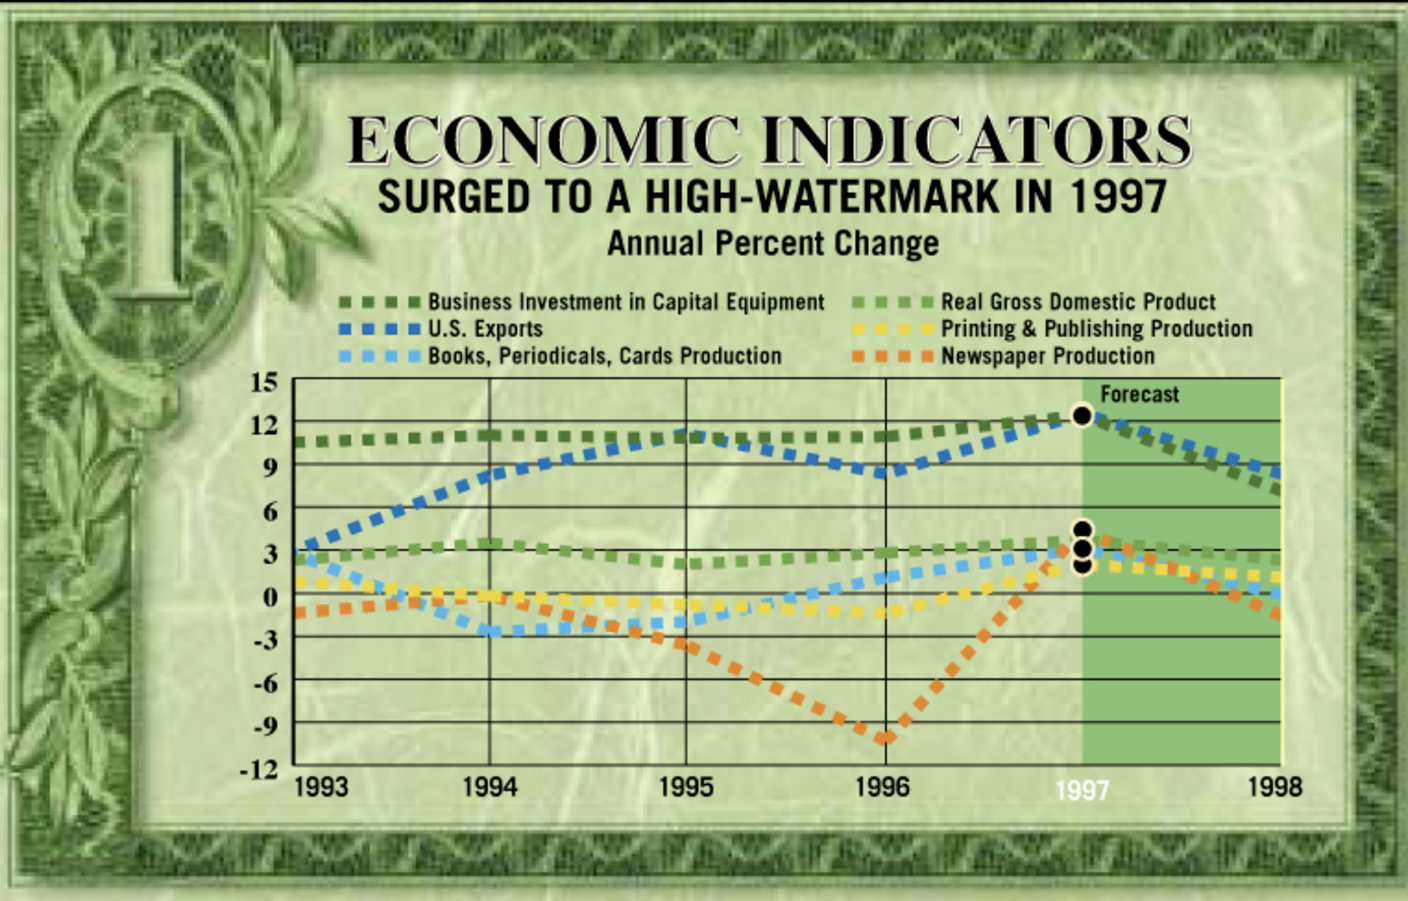
Client: Graphic Arts Monthly
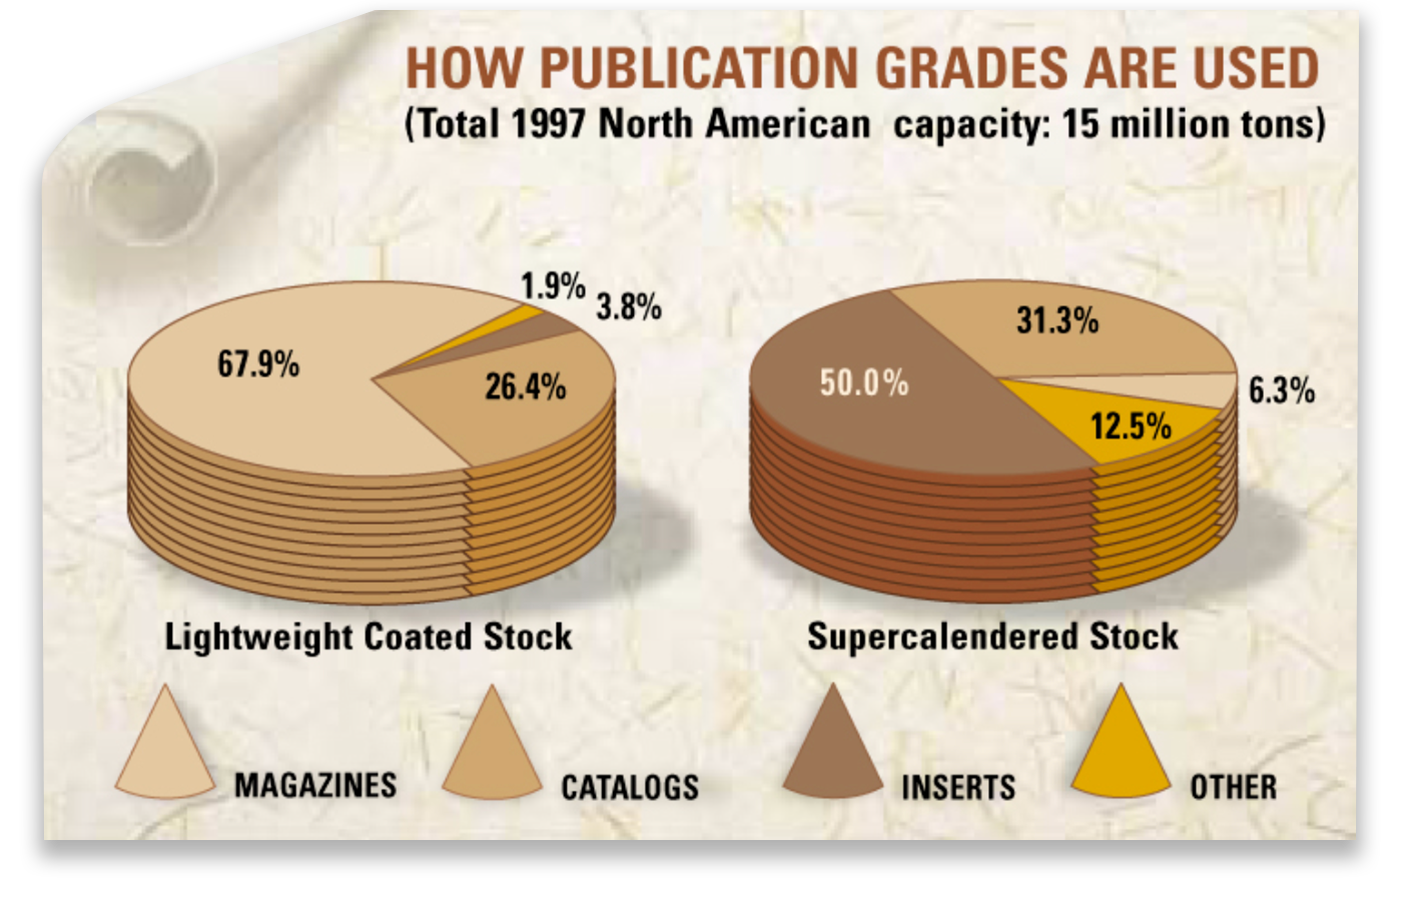
Client: Graphic Arts Monthly
Infographics

Client: iQommerce
Infographic designed to appear on the client’s website utilizing their branding.
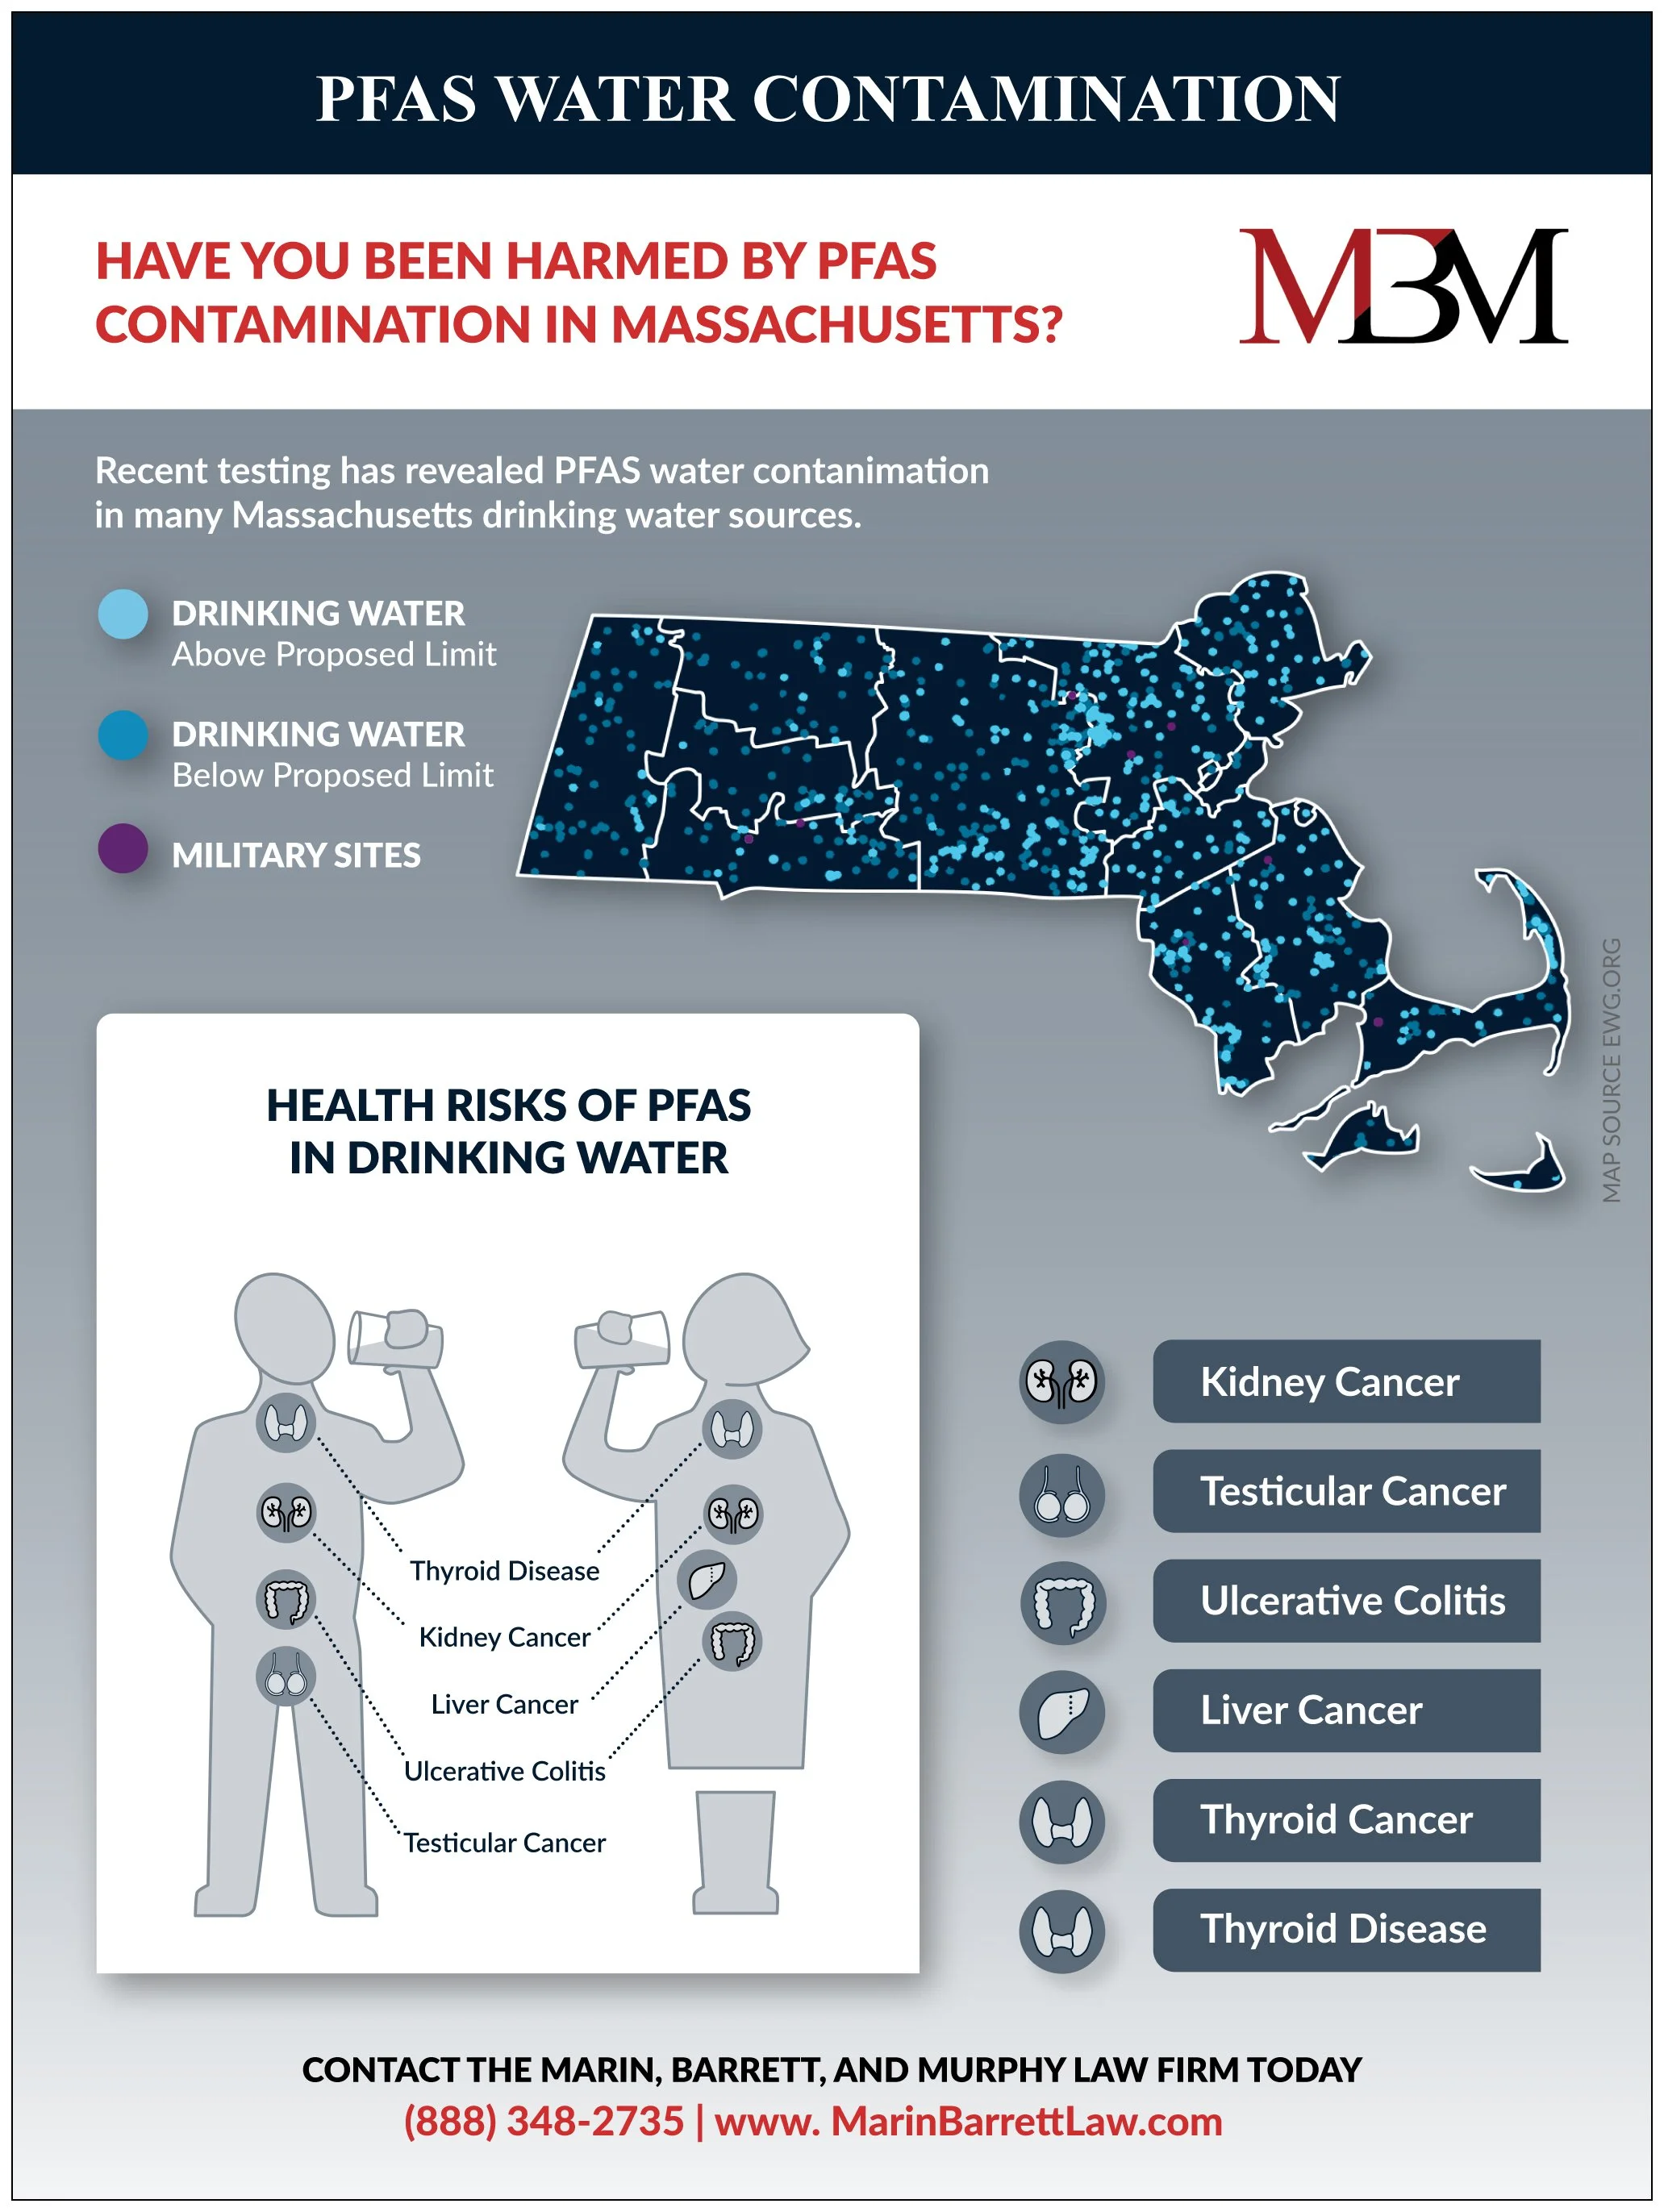
Client: Marin, Barrett, and Murphy Law
This infographic was designed to appear on the client’s website utilizing their branding. There was an infographic made for each state. The different colored dots on the state maps were done by layering and then refining them in Photoshop.
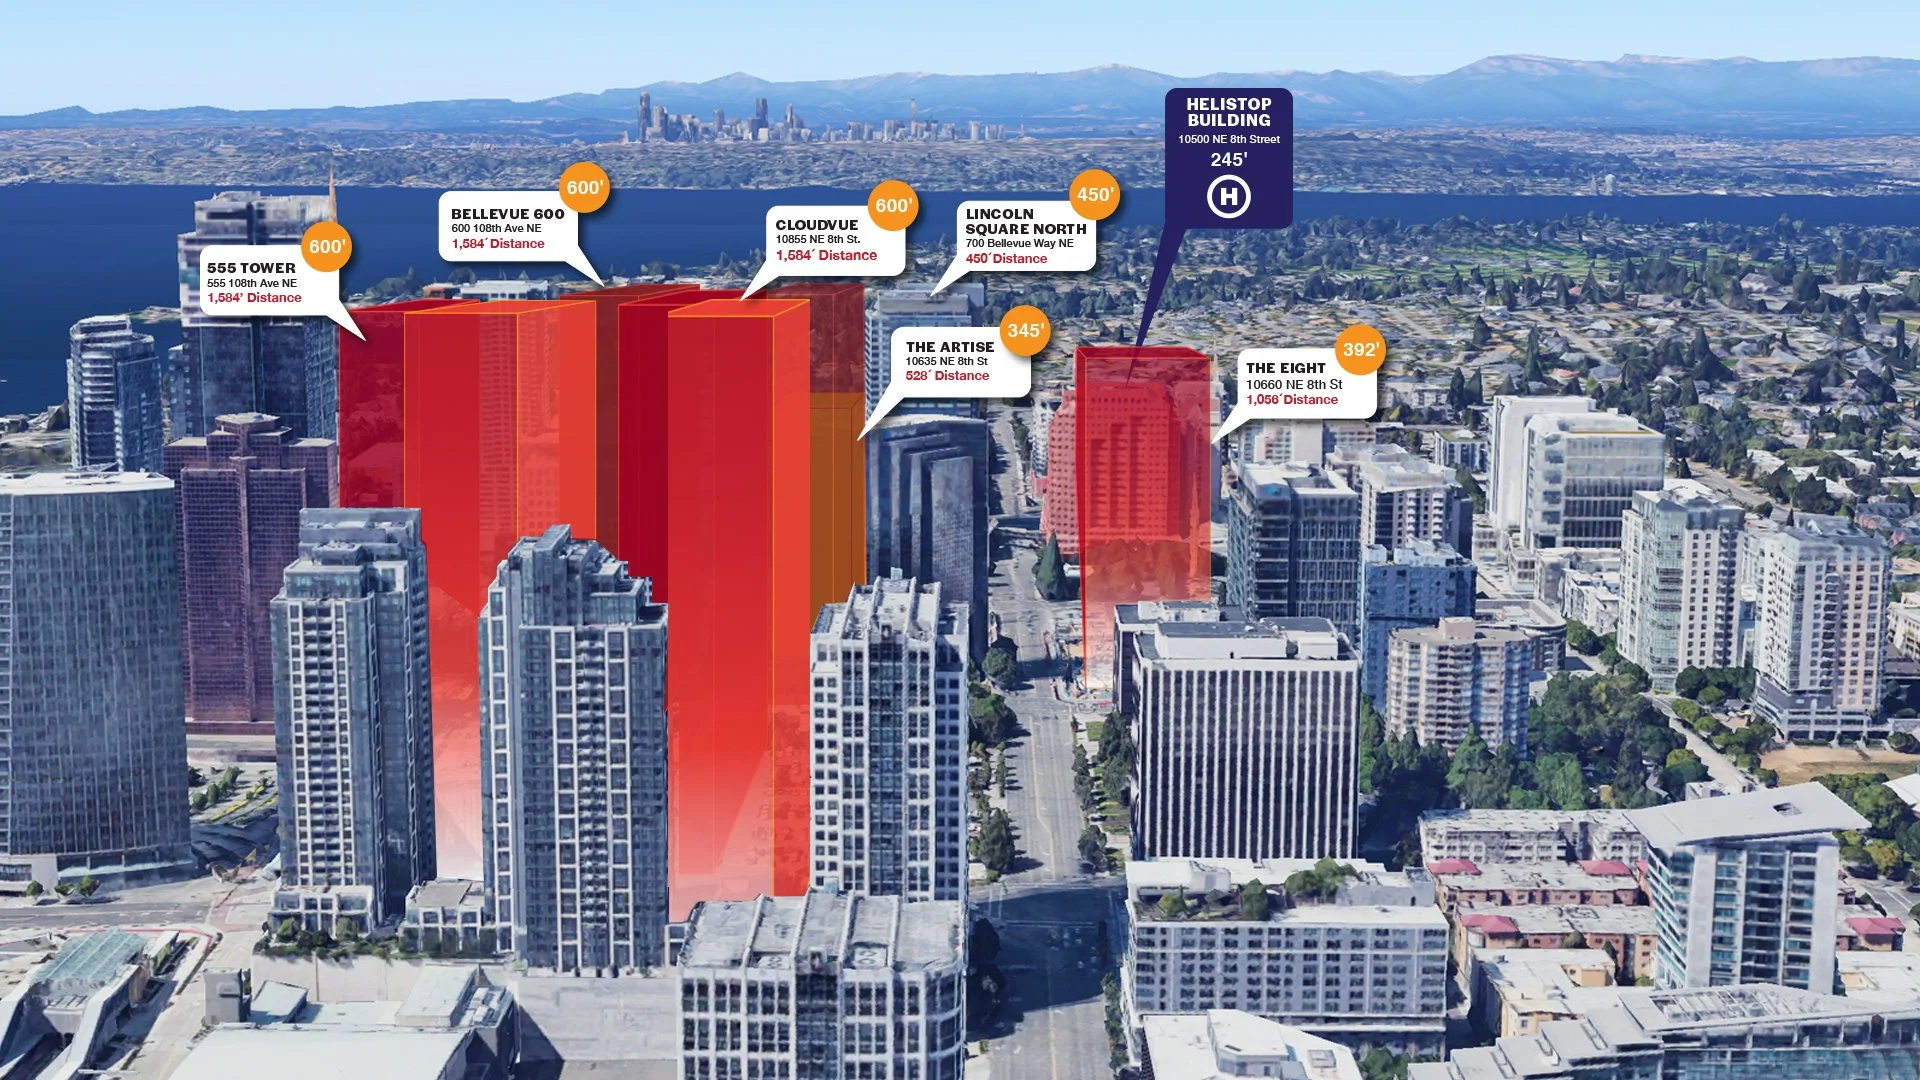
Client: Tom Luce
A challenging infographic that needed to show how proposed new buildings would effect safety in the location because of the proximity of an existing heliport.
I researched the site using google maps both from an arial and ground level view and using my calculations based on existing building heights indicated the proposed buildings in relation to them, in perspective, and utilized transparency for ease of communication to the viewer.
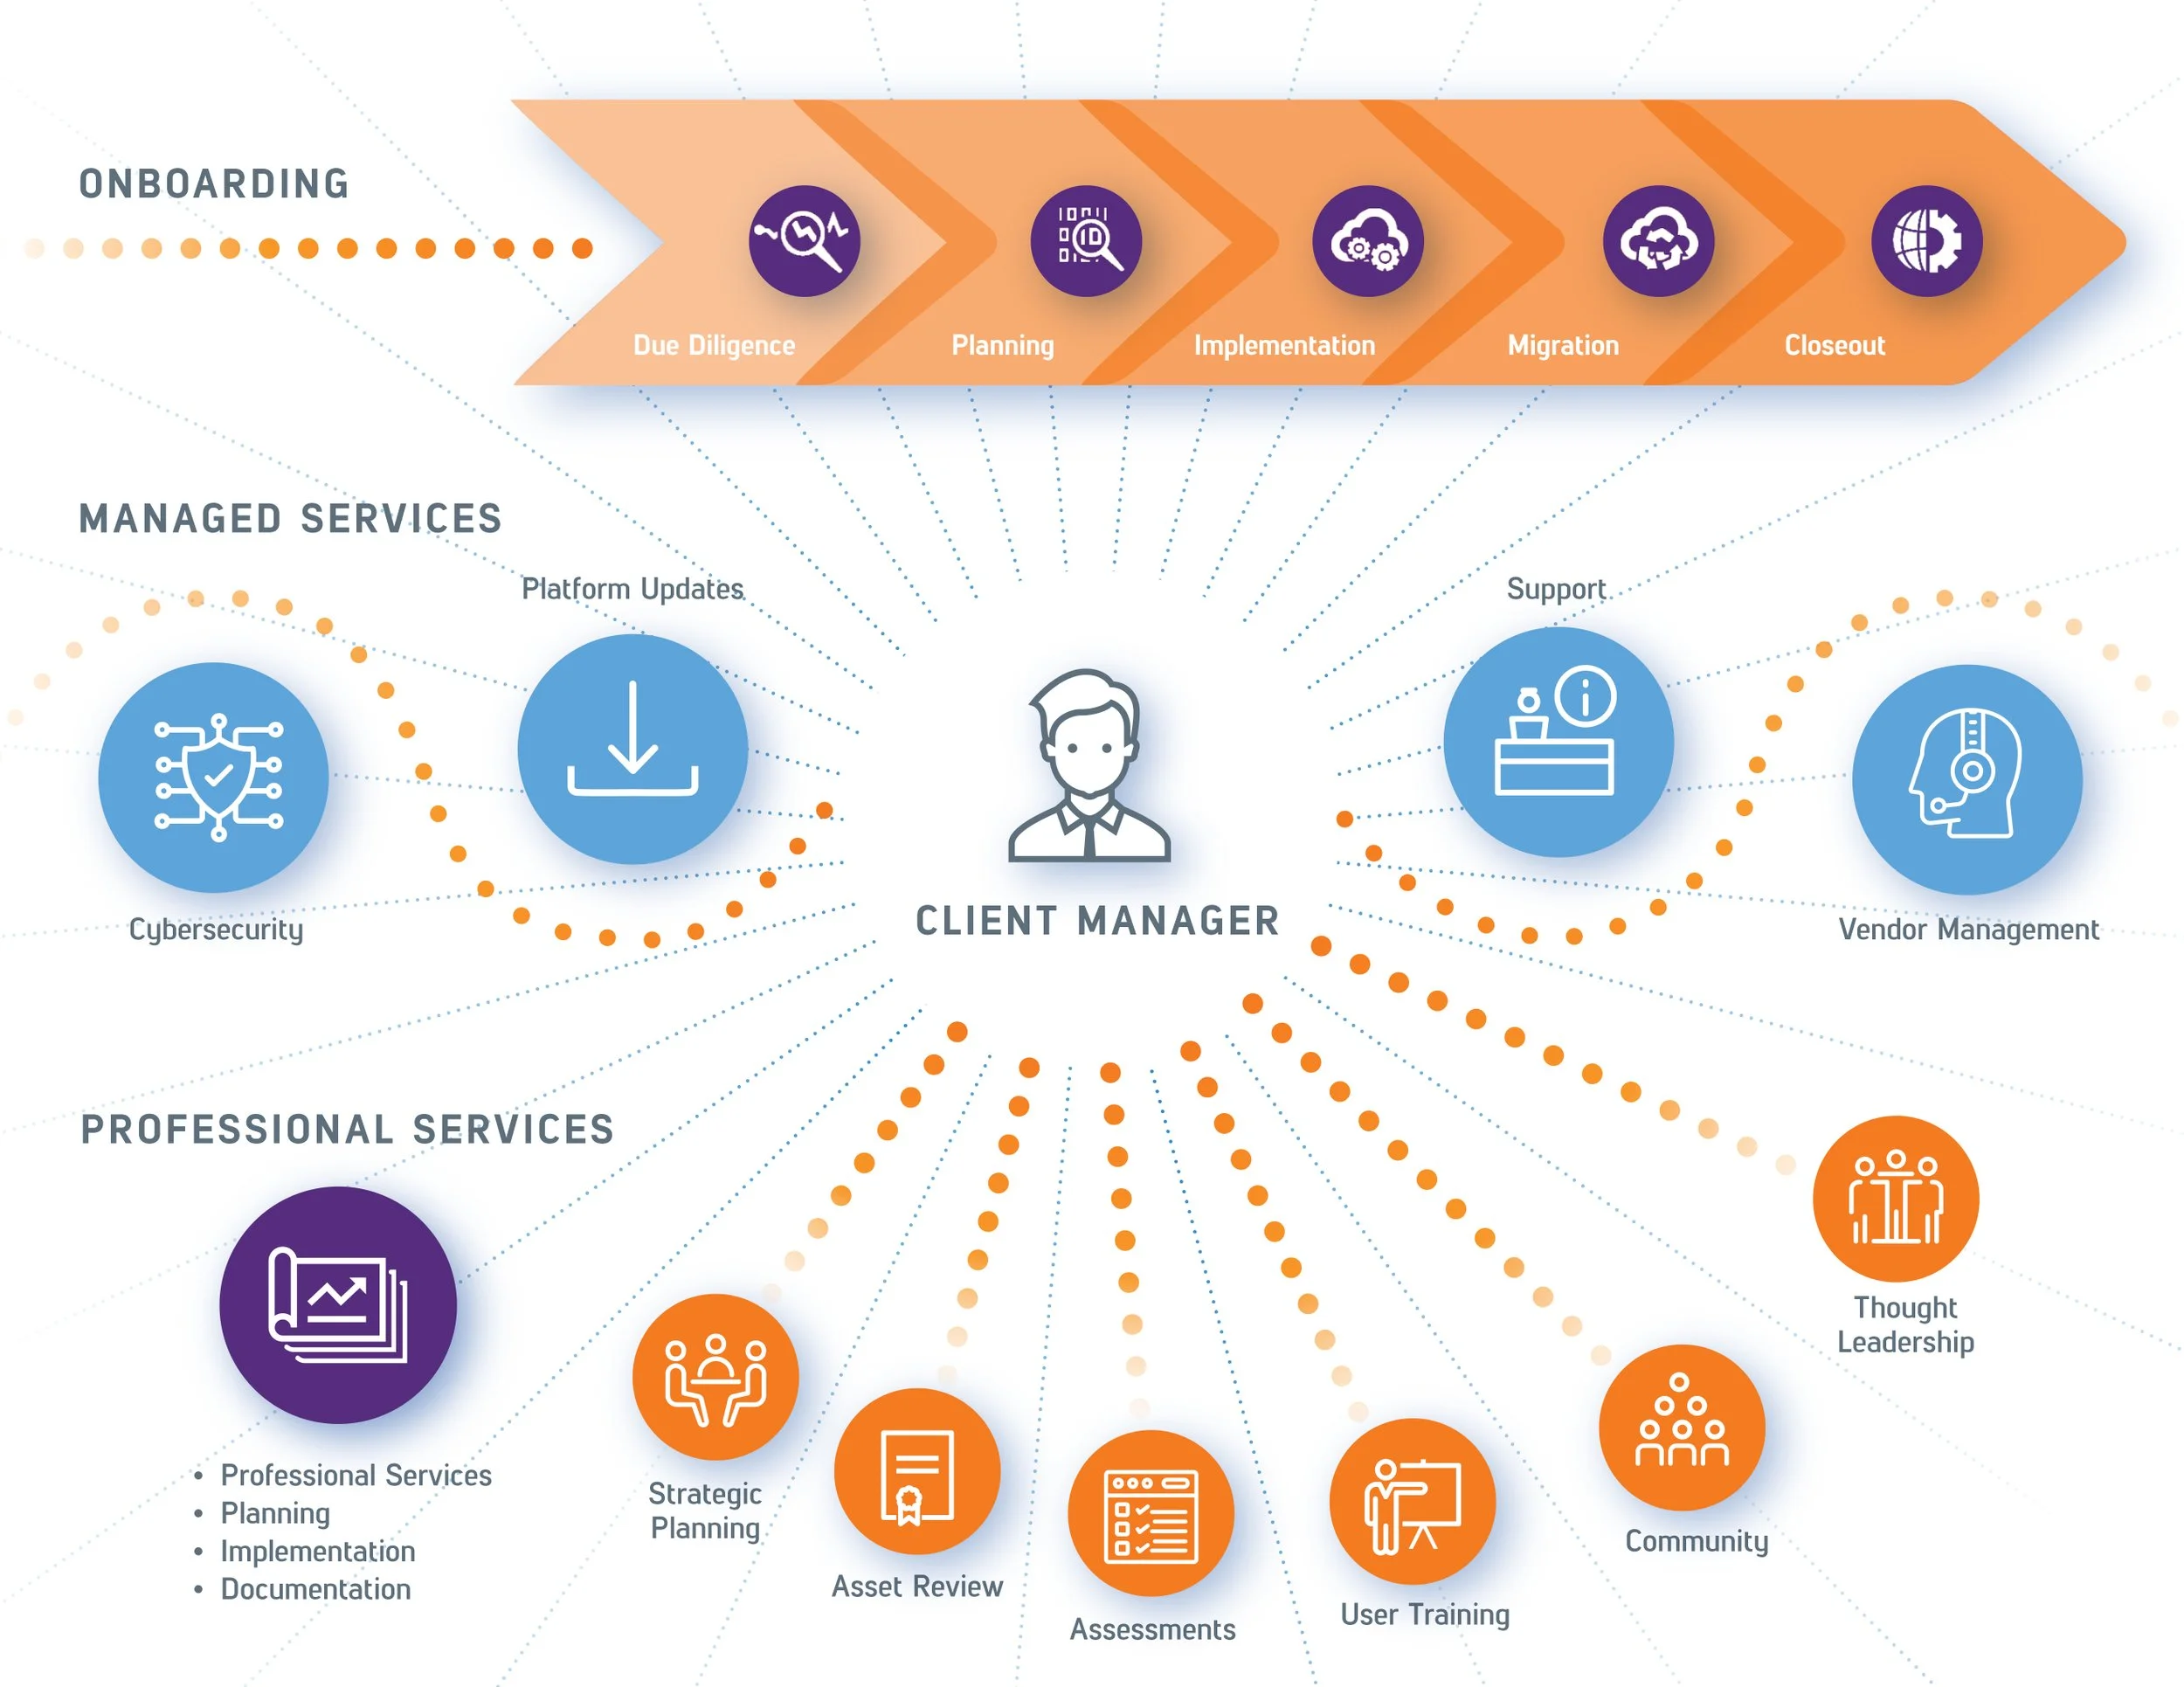
Client: Morris Tabush Group
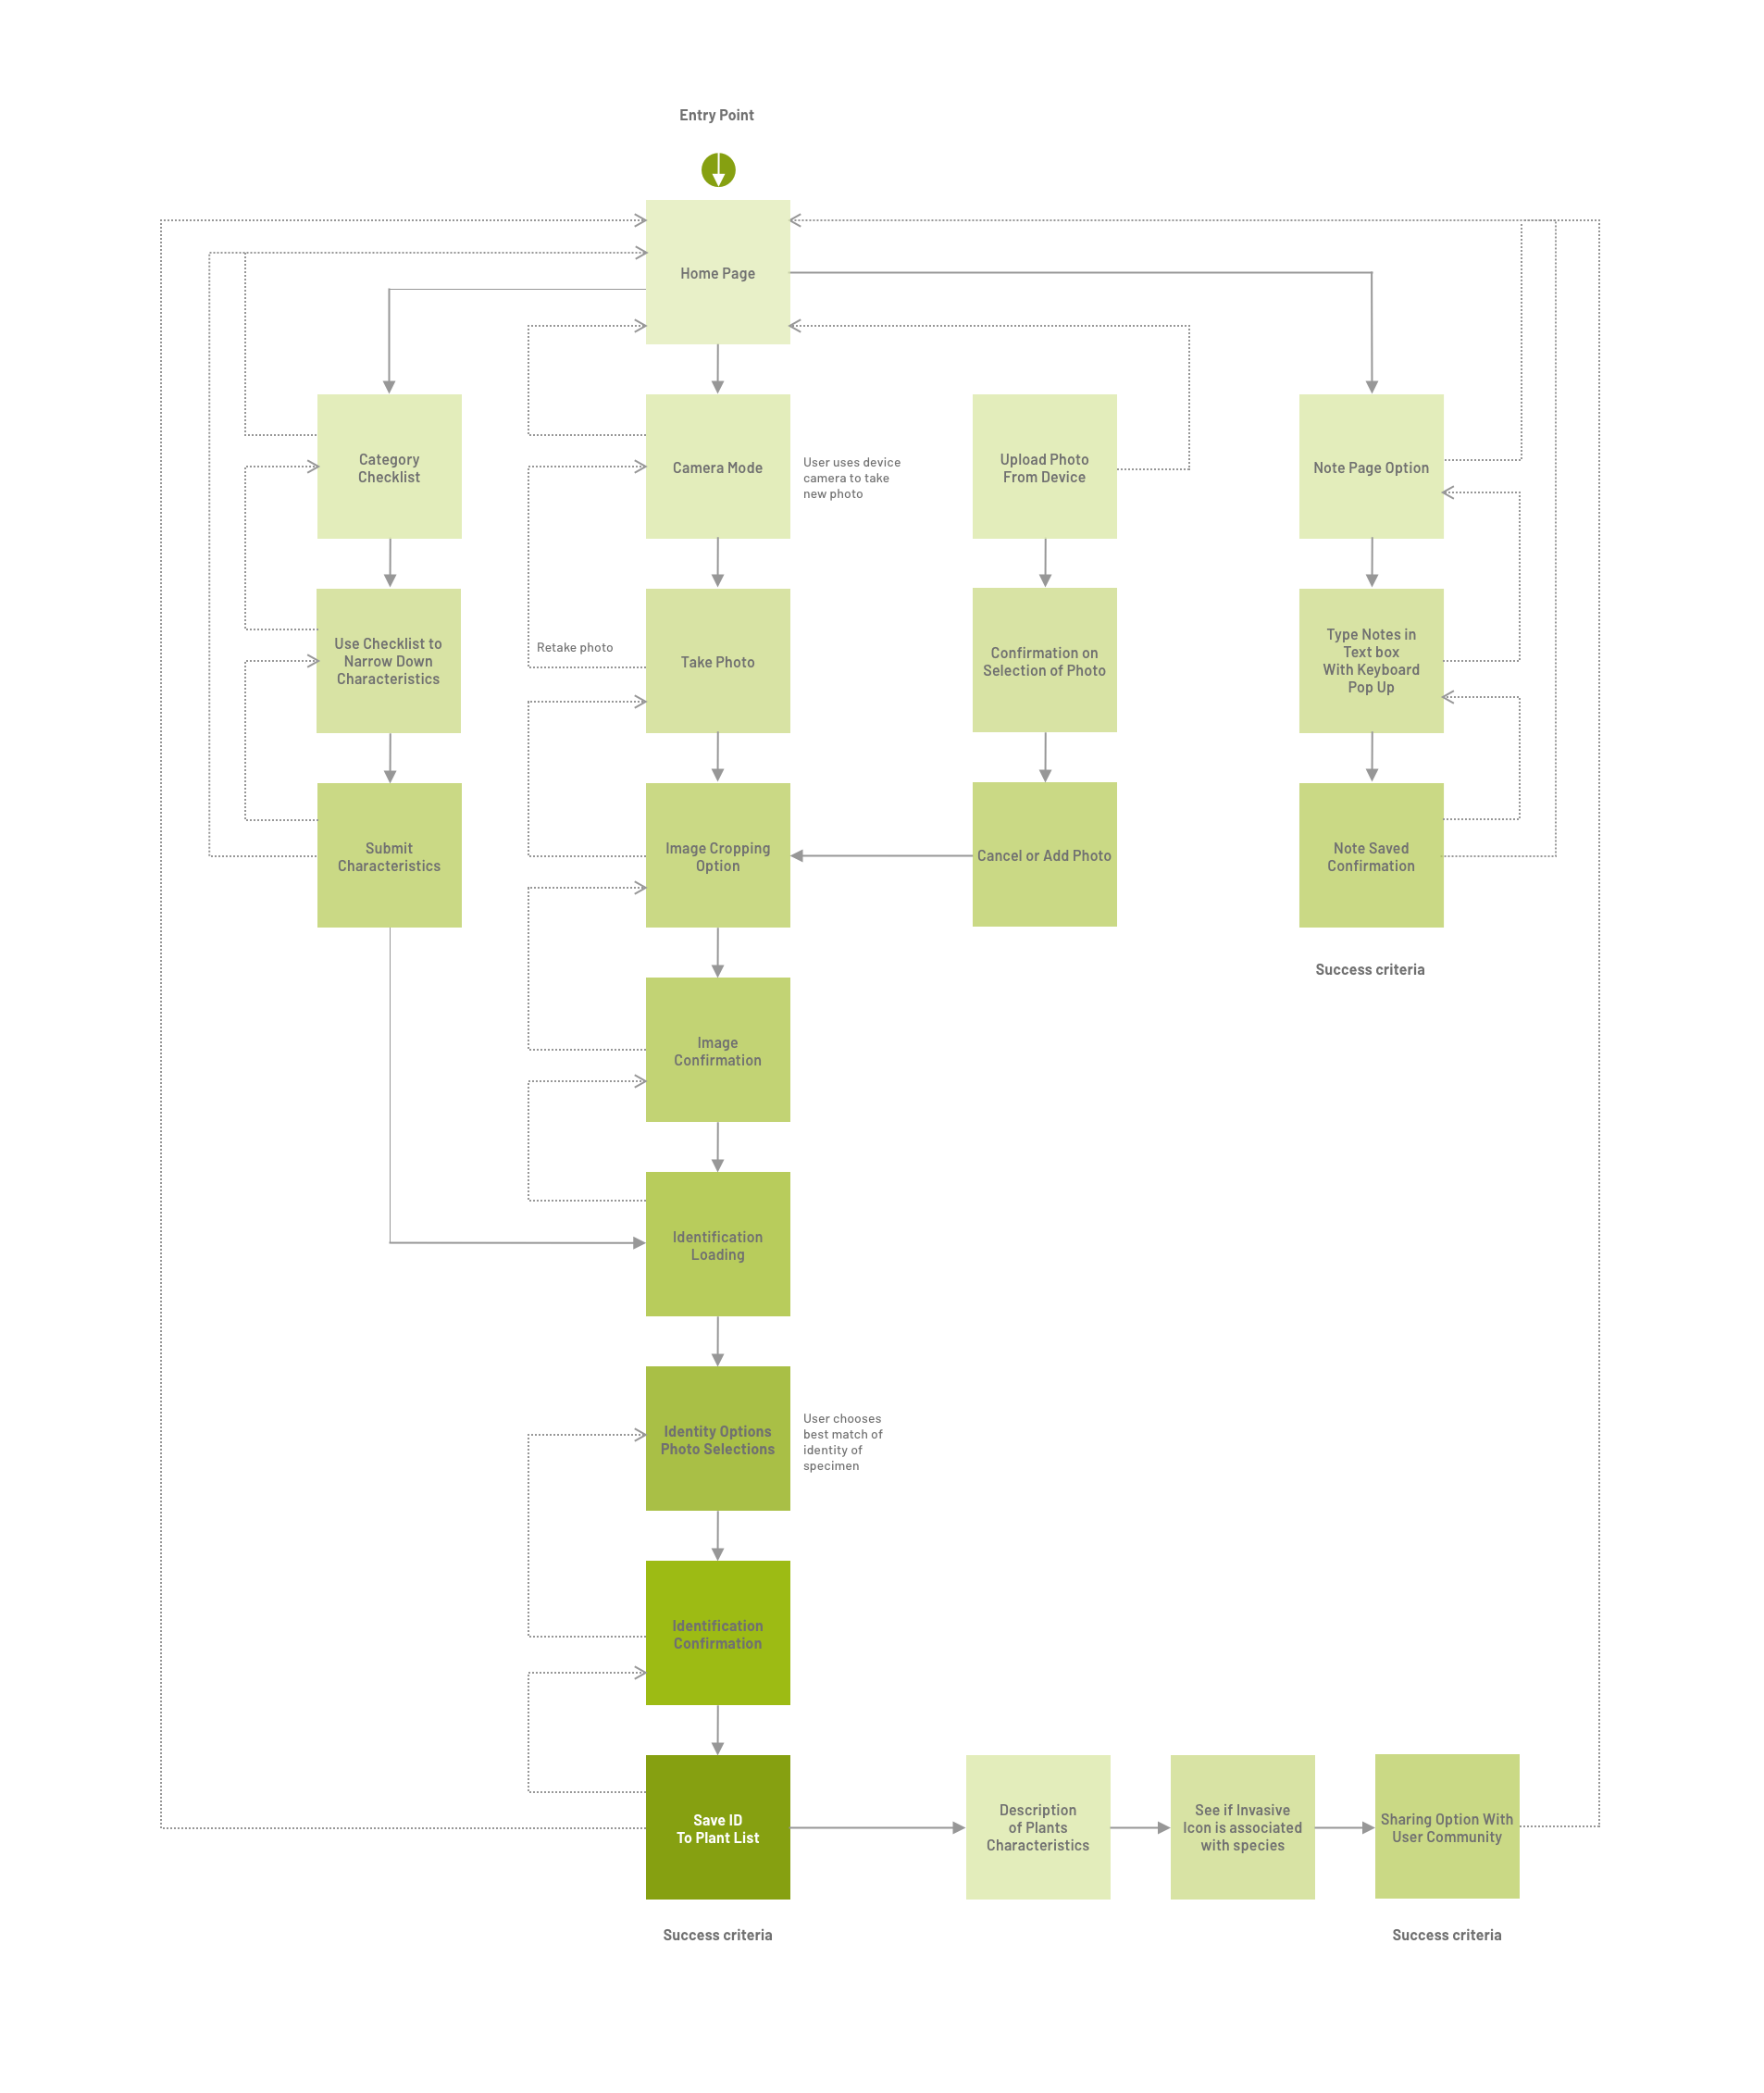
Client: IDFlora
User Flow Diagram for an App Design
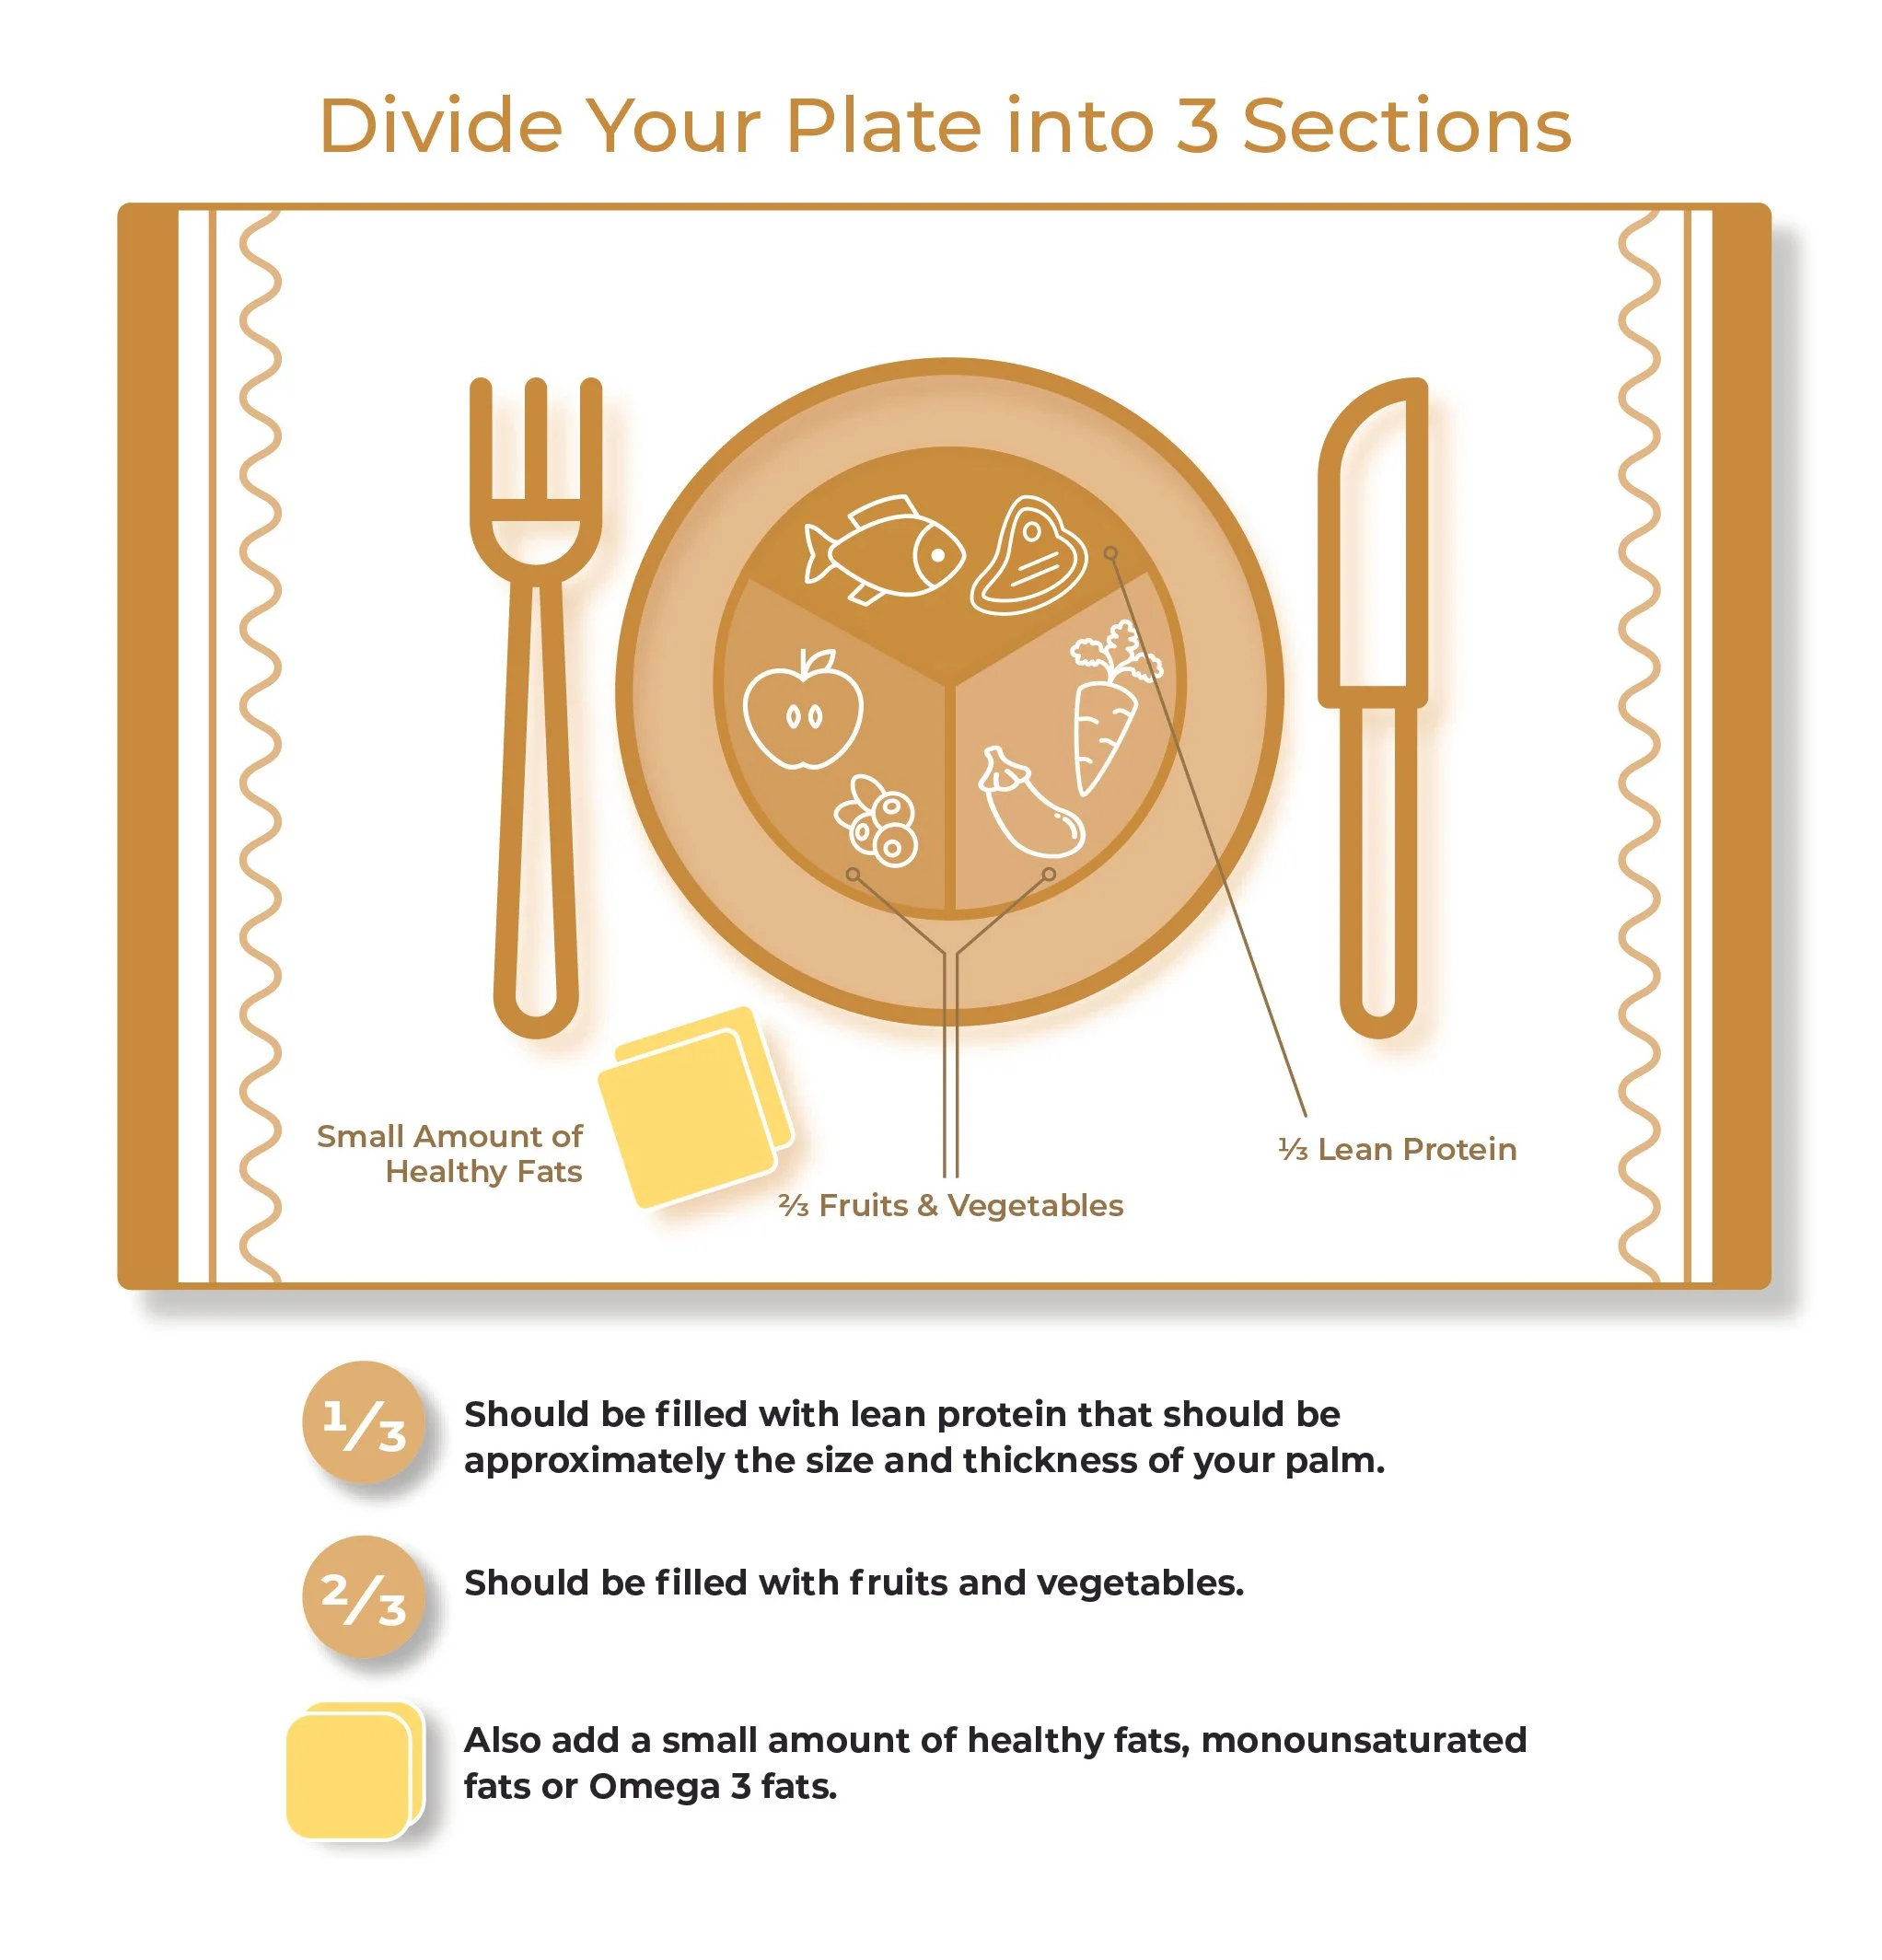
Client: Garcia Spa
This infographic was designed for a booklet on healthy eating and weightloss.